Light, understood as electromagnetic radiation, is a great source of information for data analysis. Through different wavelengths, light interacts with matter in specific ways, allowing physical, chemical and structural properties to be identified. In this article we will address 3 different types of light waves, the devices that measure them and their application in industry.
The electromagnetic spectrum encompasses multiple regions, but three of the most used for analysis are the visible, ultraviolet (UV), and infrared (IR) spectrums. Each one provides different types of information; by integrating the different spectra complementary information is obtained for multiple industrial and scientific applications. This interaction gives rise to analytical techniques such as spectroscopy.
1. Visible Light Spectrum
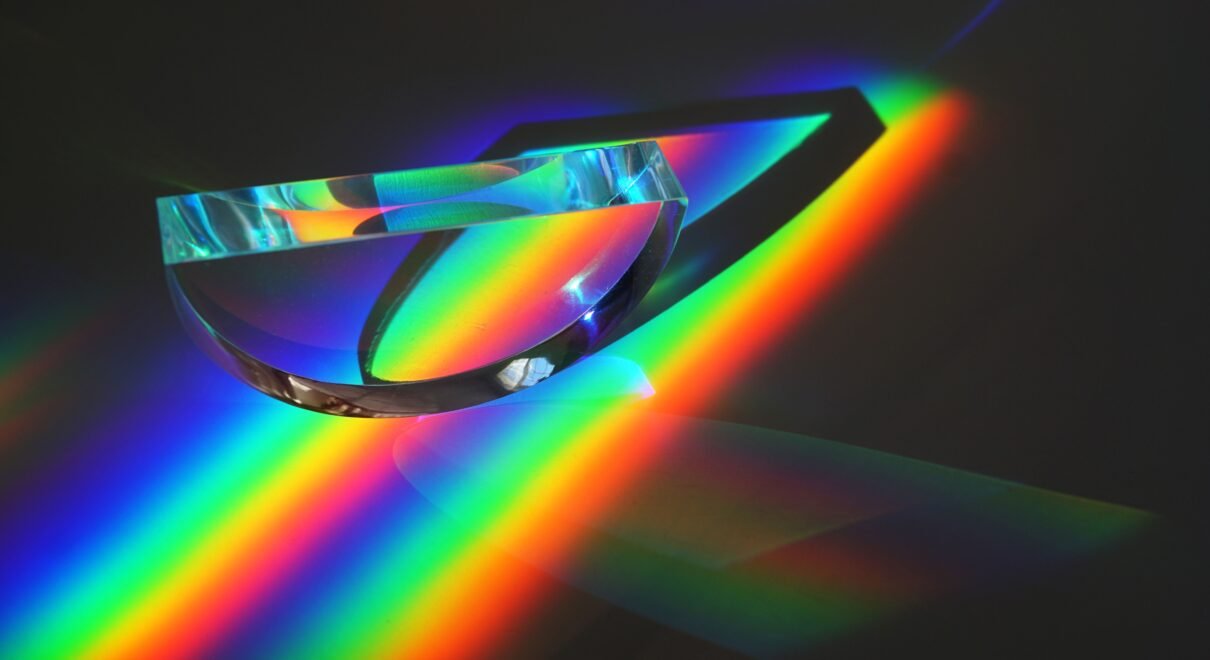
The visible spectrum (approximately between 400 and 700 nm) is the region that the human eye can perceive as colors. Beyond visual perception, this spectrum is widely used for the quantitative and qualitative analysis of materials.
Main devices
- Digital and industrial cameras
- RGB and multispectral sensors
- UV-Vis Spectrophotometers
- Photodetectors (photodiodes and phototransistors)
Information obtained
- Color and appearance of materials
- Concentration of compounds in solutions
- Changes in chemical reactions
- Optical Properties of Surfaces
Professional and industrial uses
- Quality control in food, cosmetics and pharmaceuticals, where color is a key indicator of product consistency.
- Chemical and biological research, to measure concentration of proteins, DNA, and other compounds
- Industrial machine vision, where cameras inspect defects in products or account for production quantities.
- Environmental monitoring, such as water quality and contaminant analysis
The visible spectrum allows visual information to be converted into quantifiable data, facilitating automation and digital analysis.

2. Ultraviolet spectrum
The ultraviolet spectrum (between 10 and 400 nm) has greater energy than visible light and is not perceptible by the human eye. This additional energy allows electronic processes to be analyzed in molecules.
Main devices
- UV Spectrophotometers
- UV lamps
- UV Sensors
- Fluorescence Systems
Information obtained
- Electronic structure of molecules
- Identification of chemical compounds
- Presence of biological substances or contaminants
Professional and industrial uses
- Pharmaceutical and chemical control, to determine purity and concentration of compounds.
- Forensic analysis, where UV fluorescence reveals non-visible residues.
- Food industry, to detect contaminants or verify quality
In data analysis, the UV spectrum is especially valuable because it allows detecting information that is not visible to the naked eye, expanding diagnostic capacity.
3. Infrared spectrum
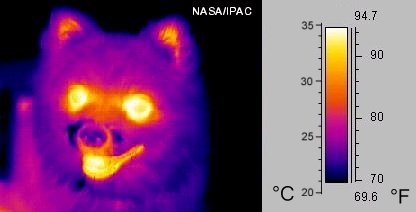
The infrared spectrum (from 700 nm to several micrometers) is mainly associated with thermal radiation. This spectrum is key for analyzing molecular vibrations and temperature.
Main devices
- Thermal imaging (infrared) cameras
- IR and FTIR Spectrometers
- Infrared temperature sensors
- Thermal Detectors and Thermocouples
- LiDAR distance meters.
Information obtained
- Temperature and thermal distribution
- Molecular composition (chemical vibrations)
- Structural properties of materials
Professional and industrial uses
- Predictive maintenance, using thermography to detect failures in industrial equipment due to heat concentration.
- Security and surveillance, with infrared motion sensors that detect human presence or for surveillance with night cameras.
- Chemical and materials industry, to identify compounds using IR spectra.
- Medicine, in thermal diagnosis and non-invasive temperature measurement.
The infrared spectrum excels in data analysis because it allows invisible thermal and molecular phenomena to be observed, which is crucial for the optimization of industrial processes.
Spectra Integration
A key trend today is the integration of multiple spectra (UV, visible and IR) using spectral and hyperspectral sensors. These systems capture information at multiple wavelengths simultaneously, generating a “spectral profile” or unique signature of each material.
For astronomical sciences, the measurement of broad electromagnetic spectra makes it possible to capture properties of celestial bodies and their composition, using the spectrum of visible light, UV, IR, radio signals and gamma radiation.
The combination of spectra significantly expands the amount of information available, transforming light into a rich source of multidimensional data.
Conclusion
Light, in its various forms, is much more than a means of illumination: it is an analytical tool capable of revealing fundamental properties of matter. While the visible spectrum allows visual information to be interpreted, the ultraviolet reveals electronic details and the infrared exposes thermal and molecular characteristics.
The joint harnessing of these spectrums, along with specialized devices and data processing techniques, has driven significant advances in industries such as pharmaceuticals, manufacturing, energy, and healthcare. In this context, light is positioned as a key pillar in the transformation towards smarter and data-driven systems.